

A Structured Approach to Bridge Management
Analysis of Linea's Native Yield program
Linea’s Native Yield program transforms the bridge from a simple pass-through mechanism into an active balance sheet. When users deposit ETH on Ethereum, the bridge records an ETH asset on the origin chain and simultaneously issues a corresponding liability on Linea. Users treat this liability as immediately redeemable at par, regardless of how the underlying ETH is managed.
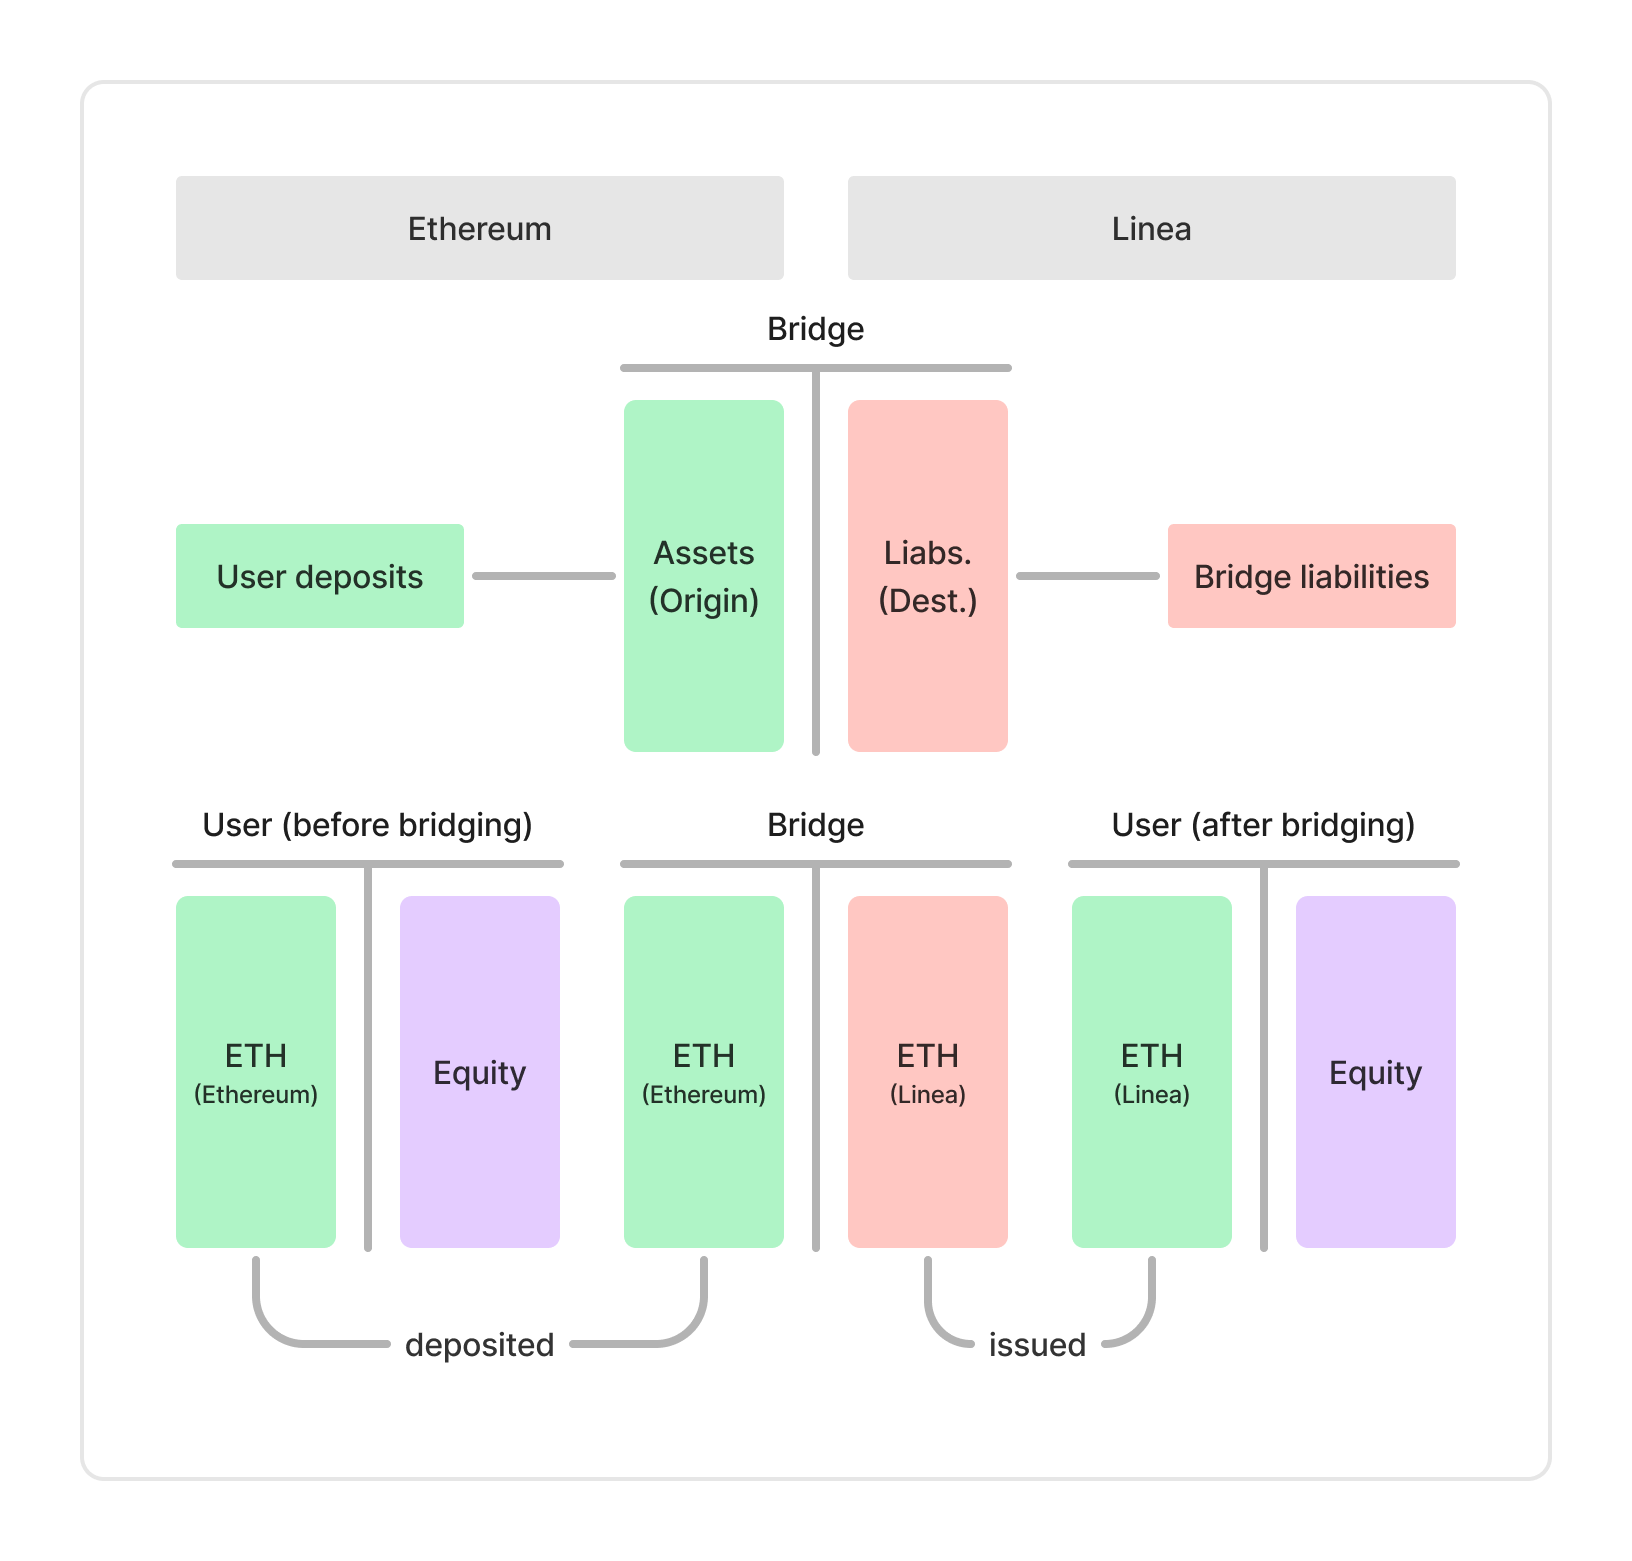
This balance sheet becomes more complex once a portion of the ETH asset base is staked. Staked ETH generates yield, but no longer converts back to liquidity on demand. It can be encumbered by exit queues, validator delays, and the operational dynamics of Ethereum’s consensus layer. What results is classic asset–liability management (ALM), where assets now pay back slowly and liabilities can be called instantly.
While the bridge’s balance sheet appears simple, its behavior is dynamic. What matters for solvency is not the total amount of ETH held but the timing and accessibility of that ETH when redemptions arrive. Staked ETH introduces duration into what was previously a fully liquid position, and the bridge must therefore manage liquidity buffers, staking allocations, and slashing reserves to ensure it can always meet withdrawals at par.
We therefore evaluate the balance sheet through three interconnected dimensions:
Liability behavior, captured by the timing and clustering of bridge outflows;
Asset behavior, including the liquidity profile of staked ETH and its exposure to validator slashing; and
Economic and market dynamics, which influence flows, yield differentials, and redemption pressure.
What follows is a set of quantitative observations and practical recommendations for Linea to safely pursue staking yield without compromising instant redemption guarantees.
Liabilities: Bridge Flows & Duration
The liability side of the Linea bridge is shaped entirely by user withdrawals: every bridge token represents an instantly redeemable claim on ETH, and users exercise that right in predictable but highly uneven patterns. The bridge’s solvency is determined not just by how much ETH it holds, but by when that ETH must be delivered relative to withdrawal timing. Understanding the flow dynamics is thus the first essential step in sizing liquidity buffers, determining how much ETH can be safely staked, and defining the operational posture required for Native Yield.
Historical flow data from 2024–2025 exhibits a consistent pattern. Most days show negligible net movement with deposits and withdrawals roughly in equilibrium. But this stability is punctuated by short, intense bursts of redemptions, periods where users withdraw rapidly for a few days and then flows stabilize again. These bursts are not theoretical edge cases; they appear repeatedly across history and occur in response to market volatility, yield differentials, incentive programs ending, or broad shifts in ecosystem sentiment.
The magnitude of these burst events is best seen in the statistical distribution of outflows. The table below depicts the 1-day, 7-day, and 14-day outflow percentiles as a share of bridge TVL, illustrating how sharply user flows can cluster in short windows.
A graphical representation of these flows shows the same phenomenon more intuitively, where redemptions surge suddenly, peak quickly, and then dissipate. The system rarely experiences a sustained 30-day bleed; instead, stress compresses into the first 7–14 days. The implication for Linea is straightforward.
To remain liquid, Linea must be able to satisfy the largest 7-14 day outflows without relying on fast staked ETH withdrawals
Ethereum’s exit process does not operate on short timeframes. Even in benign conditions, unstaking tens or hundreds of thousands of ETH takes several days. In stressed conditions, it takes significantly longer. This timing mismatch defines the ALM boundary.
This matters because a bridge with perfect asset quality but insufficient short-term liquidity can still fail to meet user expectations. Linea’s liabilities are near-instantaneous, therefore, the first week of redemptions is decisive. If the liquidity buffer cannot cover this window, Linea would be forced into less attractive alternatives: selling staked ETH or more likely delivering liquid staked ETH which could ultimately create user delays or discounts, all of which could ultimately erode trust in the bridge’s par guarantee.
The historical 99th percentile 14-day event of ~30–35% of TVL therefore becomes a practical design anchor. The goal is not to maintain a buffer equal to that size at all times, but rather to ensure that liquid ETH, accessible secondary liquidity and governance levers together exceed this demand shock.
These flow patterns also interact with market structure. Our analysis shows that weeks with the largest outflows often coincide with:
yield compression relative to mainnet staking,
reductions in incentives,
elevated volatility, and
deleveraging in LRT and staking markets.
This establishes a relationship between DeFi conditions and liability-side stress, which we return to later in the economic risks section. For now, the key point is that user flows can and will cluster sharply, and these clusters are the events Linea must design for.
Liability-side behavior tells us the demand for liquidity, large, sudden, short-duration outflows, is roughly bounded by historical 7–14 day extremes. The asset side, which we analyze next, tells us the supply of liquidity, or how quickly ETH can be unstaked, sold, or synthesized into liquid value.
The distance between these two curves is the ALM gap Linea must bridge.
Assets: Staked ETH Liquidity, Duration and Impairment
Ethereum’s withdrawal mechanics define the liquidity profile of Linea’s staked ETH assets. Once ETH is staked, the timing of when it becomes usable again is no longer under Linea’s control; it is dictated entirely by exit queue conditions and network validator activity.
Over the past year, Ethereum’s exit queue has swung from effectively zero days during quiet periods to nearly 50 days during periods of elevated exits. Even today, the network sits in a materially delayed regime with exit queue of roughly 1.15M ETH, a wait time of ~20 days, and a sweep delay of ~8–9 days, implying ~30 days from exit initiation to final liquidity.
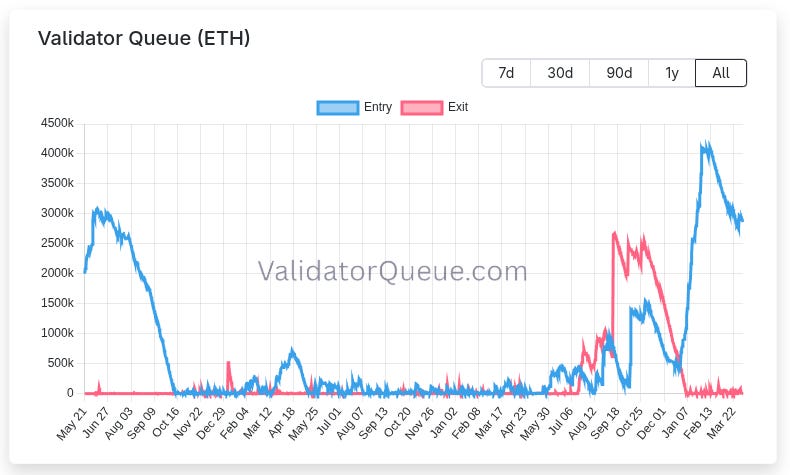
The current environment illustrates how quickly conditions can shift. The timing of liquidity from staking is therefore state-dependent and external, driven entirely by global validator behavior rather than anything Linea can influence.
The solvency implication is relevant during the 7–14 day windows in which Linea has historically experienced its largest outflows. These assets cannot be realized within the time horizon that matters most for redemption pressure.
To quantify how much ETH Linea can safely stake, we model solvency using two standard ALM metrics:
A 14-day Liquidity Coverage Ratio (LCR), comparing available liquidity to the stressed outflow distribution;
A Net Stable Funding Ratio (NSFR) analogue, assessing multi-week solvency after immediate liquidity stress passes.
We vary liquidity buffers from 20% to 60% of TVL and evaluate each configuration’s solvency under the 98th, 99th, and 100th percentile outflow scenarios.
The results show a clear threshold.
Buffers below ~25–30% fail to maintain LCR > 1 under multiple plausible stress cases, meaning short-term solvency depends on distressed stETH sales or discretionary gating. Buffers between 35–45%, however, consistently maintain LCR > 1 even under the worst 14-day events in the dataset, indicating resilience without relying on unstaking or emergency mechanisms.
To complement this, we evaluate long-horizon funding stability through an NSFR-like metric. This measures the relationship between Linea’s long-term illiquid assets (staked ETH) and its stable funding (deposits that remain after initial outflows).
The NSFR analysis reinforces the same conclusion:
Buffers ≥40–45% keep funding stable across 30–90 days, while buffers ≤30% introduce meaningful long-term instability if exit conditions worsen or stress persists.
Short and long horizon solvency can also be viewed through the liquidity gap, the portion of outflows not covered by the buffer and which therefore must be financed through stETH sales or intervention.
This quantifies the magnitude of stETH distributions required under different configurations. At today’s TVL, a ~5–10% distribution requirement (35–40% buffer scenario) is entirely absorbable by secondary markets without meaningful discounts. A 10–15% liquidation requirement (30% buffer) is still feasible, but introduces more execution risk to users and dependence on clean governance coordination. As TVL scales, the feasibility of similar liquidation volumes diminishes proportionally.
Together, these solvency metrics outline a clear operating band. Liquidity buffers in the 35–45% range maintain solvency under all observed short-term outflow scenarios, preserve funding stability into the 30–90 day horizon, and minimize reliance on secondary market sales. Buffers below this range remain viable but require more active governance oversight; buffers above it deliver diminishing marginal solvency benefit at the expense of yield.
All of these solvency metrics evaluate Linea’s ability to withstand liquidity stress assuming the value of its staked ETH remains intact. In practice, the asset side can also experience principal impairment. The most relevant source of asset impairment for a staking bridge is validator slashing, and its effects can be incorporated alongside liquidity stress.
Slashing Risk and Asset Impairment
Slashing occurs when a validator violates consensus rules designed to preserve network security and liveness. While the precise mechanics sit outside the scope of this report, the main categories of misbehavior are well-understood and can be summarized as follows:
Double-signing arises when a validator signs two conflicting blocks or attestations for the same slot, typically due to misconfigured redundancy or replayed signing keys.
Surround voting occurs when attestations overlap improperly with prior ones, often linked to key reuse or client inconsistency.
Proposer equivocation involves proposing two blocks in the same slot, usually stemming from automation or relay-level failure.
Correlated downtime or client-wide bugs are the most economically meaningful cases, where multiple validators misbehave simultaneously due to a shared dependency — a client bug, relay outage, cloud zone failure, or slashing-protection corruption.
Malicious coordination, while theoretically part of the protocol’s threat model, lies outside realistic operational risk for a permissioned staking operator set such as Linea’s.
These categories matter because Ethereum’s penalty function is correlation-sensitive. The more validators misbehave in the same window, the higher the penalties each validator suffers, which can amplify losses beyond what any isolated validator would experience individually.
The dominant determinant of slashing severity is not validator “skill,” but operational correlation across a validator set. When many validators share the same client, infrastructure, key domains, relays, or runtime environment, a single software or system failure can cause a cluster of validators to misbehave simultaneously. This is the essence of slashing tail risk, the correlated operational domains.
From a bridge or vault perspective, this is best understood as a form of counterparty concentration risk. Conversely, the simplest and most powerful mitigation is diversification across operational domains, which decomposes a large correlated failure mode into several much smaller ones.
The forms of diversification that matter most are:
Consensus clients: Lighthouse, Prysm, Teku, Nimbus, Lodestar
Execution clients: Geth, Nethermind, Besu
Slashing-protection domains: entirely independent slashing-protection DBs and signer daemons
Infrastructure environments: cloud vs. bare metal, distinct cloud providers, geographic separation, and energy/bandwidth diversity
Relay and MEV stack diversity: reducing dependence on any one builder/relay path
Each dimension reduces the cross-correlation of misbehavior. Each reduction constrains the size of any credible slashing cluster.
In practice, across five years and a validator set that has grown by orders of magnitude, Ethereum has recorded only 536 slashed validators across 138 unique slashing events, a cumulative incidence of roughly 0.001% of all staked ETH. Normalized into an annualized rate, this corresponds to 0.0002%–0.0013% of stake per year, depending on whether median or mean penalty severity is used.
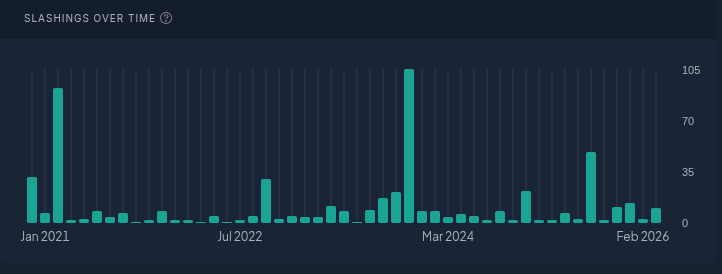
This chart makes two things immediately clear:
Slashing frequency is extraordinarily low.
Relative incidence decreases as validator count grows, reflecting an increasingly diverse and mature operator ecosystem.
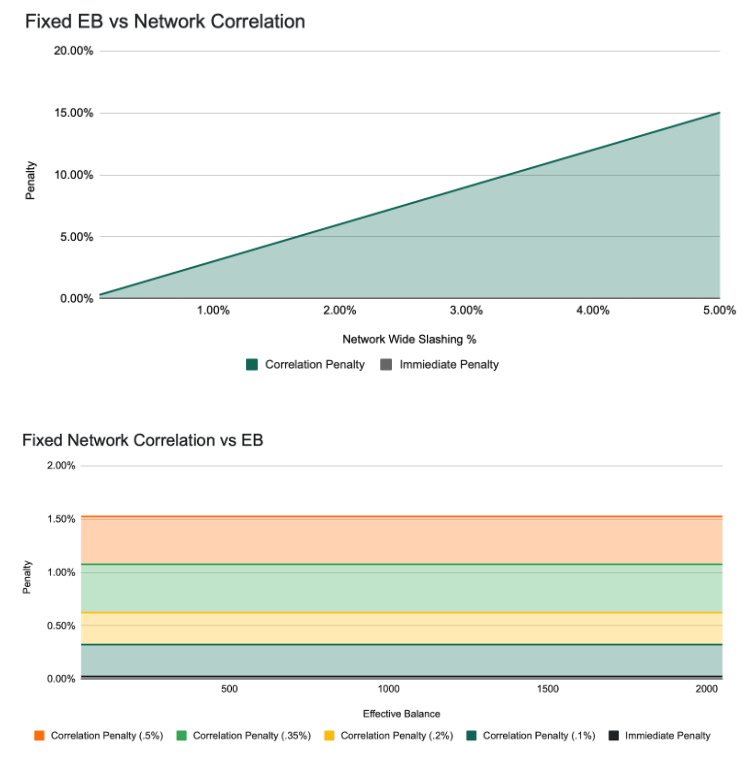
Under the current consensus rules, slashing severity is determined almost entirely by protocol mechanics rather than historical averages. Each slashing event consists of two components. First, an immediate penalty equal to the validator’s effective balance divided by 4096. Second, a correlated penalty that scales with the share of total network stake slashed within a short correlation window, equal to the validator’s effective balance multiplied by three times the fraction of network stake slashed, capped at the validator’s full balance. Once effective balance is specified, per-validator loss is therefore mechanically determined. However, the remaining uncertainty is how many validators are affected before detection halts propagation.
This structure makes probability-based modeling difficult. The historical data is too sparse to infer a meaningful distribution of correlated events, and attempting to do so would introduce false precision. Instead, slashing is best treated as an operational stress scenario, while the likelihood of a given event is unknown, the loss conditional on a plausible event can be bounded directly from protocol rules.
The formula is effectively the sum of:
Immediate penalty = EB / 4096
Correlated penalty = EB * min(1, 3*Percent of Total Network Slashed)
A simple visualization makes this clear. Holding effective balance fixed (e.g. ~1,000 ETH), total per-validator loss rises linearly with the fraction of network stake slashed, with the immediate penalty acting as a small fixed floor and the correlated component dominating once correlation increases. Conversely, holding correlation fixed, loss scales linearly with effective balance. These two curves, loss vs. EB and loss vs. correlation, fully characterize slashing severity under the protocol.
The critical structural insight is that severity scales with effective balance, but correlation does not. Correlated slashing propagates only within an operator’s failure domain, validators sharing clients, signing infrastructure, slashing-protection databases, or deployment environments. These domains are bounded in practice because validator duties are time-distributed and misbehavior is detected quickly, allowing operators to halt affected clusters after the first few slashings. As a result, even though per-validator loss grows under MaxEB, the number of validators plausibly affected in a single event remains limited.
This boundedness simplifies reserve setting, but does not eliminate uncertainty. While the immediate slashing penalty is mechanically small, correlated penalties can materially increase losses if multiple validators are affected within the same operational domain. What cannot be known ex ante is how far such a correlated event propagates before detection halts it. As a result, reserve sizing cannot be justified through probability-weighted loss estimates. Instead, the reserve is set to absorb a credible, bounded local event in which correlation is limited by diversification across clients, infrastructure, and signing domains, and where losses are dominated by the immediate penalty plus a modest correlated component rather than by system-wide bug.
Within the solvency framework established earlier, this leads to a practical, stress-based recommendation rather than a probabilistic one. A slashing reserve in the range of 0.25–0.50% of total staked ETH is sufficient to absorb a realistic operator-local slashing event without pushing liquidity coverage ratios below threshold during a stressed outflow window. This range is intentionally conservative relative to the immediate penalty alone, but materially smaller than what would be required to insure against unbounded correlation. The appropriate position within the range should be guided by observed effective balances and demonstrated operator segregation; absent strong empirical evidence of diversification, governance should assume the upper end. Crucially, this recommendation reflects what can be reasonably insured, not an assertion that larger correlated events are impossible.
DeFi & Economic Dynamics
While validator failures and withdrawal constraints define the lower bound of solvency, the upper bound is determined by DeFi market behavior. The Linea bridge sits inside an ecosystem where capital is constantly reallocated across staking, restaking, leverage, incentives, and secondary liquidity venues. These external dynamics shape redemption behavior directly through yield, funding spreads, and risk-adjusted opportunity cost.
One of the clearest empirical relationships in the dataset is the connection between levered staking spreads on Linea and user flows. The spread vs flow analysis shows a robust threshold pattern. When the spread between staking yield and funding cost is positive, flows tend to be neutral or mildly positive. As the spread compresses into a neutral band of roughly ±0.3%, flows become unpredictable and volatile. Naturally once the spread declines beyond –0.6%, outflows accelerate in severity, averaging more than 7,000 ETH in weekly redemptions, aligning with the extreme 98th–100th percentile redemption windows observed earlier.
These economic incentives offer a clear path to account for most of the short-horizon redemption spikes in Linea’s historical record.
This reflexivity is amplified by leverage. Recursive staking, LRT-collateralized borrowing, and LSD-backed credit all magnify capital’s sensitivity to yield. When funding costs increase or staking yields decline, levered positions unwind rapidly. These unwinds typically occur over the same 7–14 day horizons that bound the solvency model, meaning pressure can materialize faster than unstaking can replenish liquidity.
Market depth interacts with these dynamics in a second-order way. In benign conditions, stETH secondary markets can absorb 5–10% of TVL with modest slippage. But when spreads are negative and deleveraging occurs system-wide, depth things, discounts widen, and it becomes more costly to rely on secondary liquidity. This amplifies the bridge’s dependence on its internal liquidity buffer. The worst flow events recorded in the dataset occurred precisely when spreads were negative and liquidity was fragile, underscoring that DeFi-driven exits can tighten concurrently on both the liability and asset sides.
Finally, these dynamics often coincide with or reinforce broader conditions, such as reductions in incentives, increased staking competition, episodes of market volatility, and LRT deleveraging cycles. The combined effect can cause concentrated bursts of exits during specific windows, which drives the liquidity buffer model above.
Summary & Recommendations
This report evaluates Linea’s native yield design as a balance sheet problem. The bridge transforms instantly redeemable liabilities on Linea into staked ETH assets on Ethereum, introducing duration and external constraints that must be actively managed to preserve solvency. The analysis throughout has focused on characterizing that asset–liability mismatch, identifying the conditions under which it becomes binding, and defining a disciplined way to manage it over time.
A central empirical result is that bridge outflows are not evenly distributed. Redemptions cluster into short, intense windows, most commonly over 7–14 day horizons, while remaining relatively muted outside of stress. These clusters coincide with deteriorating economic incentives, captured most clearly by compression in the levered staking spread and are exacerbated when Ethereum exit queues lengthen, extending the period during which staked assets remain illiquid.
To ground this behavior, we refer back to the historical bridge outflows across rolling horizons. This table defines the empirical envelope of liquidity stress and is used as a reference against which liquidity buffers are sized. This table can be updated in real time and can help define how large outflows have been conditional on a given time horizon once stress has begun. The liquidity buffer policy implicitly chooses which portion of this distribution it is designed to withstand.
While a single static buffer set to guard against the most extreme stress could ensure solvency it is not efficient. Thus we recommend that when economic incentives are favorable and exit queues are short, protecting against the extreme tail imposes a large opportunity cost with limited solvency benefit. Conversely when incentives deteriorate or asset duration lengthened, operating against the median or upper middle of the distribution becomes insufficient.
To make this tradeoff operational, we implement a simple model that links observable market conditions to balance sheet posture. Ethereum exit queue data (beaconcha.in) is used to estimate the effective duration of staked assets, augmented by conservation governance reaction window. In parallel, a trailing 7-day moving average of the levered staking spread is used as a proxy for economic conditions which informs redemption pressure. Together, these inputs determine both the relevant horizon and appropriate percentile from the distribution above to guard against.
The output is a recommended liquidity buffer expressed as a percentage of current bridge TVL. This recommendation is recalculated daily as conditions change and is intended to guide governance decisions on this Linea Dune Dashboard.
Asset Duration (days): 11d
Levered Staking Spread (7d MA, bps): -40bps
Target Liquidity Threshold: P99
Recommended Liquidity Buffer (%): 36%
Recommended Liquidity Buffer (ETH): 21,667 ETH
As of April 6th, 2026
The snapshot above illustrates how the analytical framework translates into an operational balance sheet posture under current conditions. Exit queue congestion implies that staked ETH remains illiquid for several weeks, while the prevailing levered staking spread places the system in a higher-stress incentive regime. Taken together, these signals justify operating against the upper tail of the historical outflow distribution and maintaining a materially higher share of bridge TVL in liquid ETH. The recommendation is effectively a conditional posture derived from observable conditions. If conditions improve, the same methodology supports a gradual reduction in the liquidity buffer, allowing the bridge to operate closer to the efficient frontier.
Slashing differs fundamentally from redemption pressure above. It does not create an immediate demand for liquidity, but permanently reduces the value of staked ETH. For this reason, it must be addressed explicitly, but separately, within the same balance sheet framework Slashing is treated here as an operational stress scenario. Correlated slashing events are bounded in practice by operational realities of shared clients, signing infrastructure, etc which limit the failure domains, while duty rotation and monitoring constrain how far an incident can propagate. Within those bounds, a modest, dedicated reserve is sufficient to absorb a credible operator-local event without interacting meaningfully with liquidity management.
This reserve serves as structural capital intended to absorb asset impairment. It should be reviewed as validator configurations, effective balances, or operator concentration change, but it does not need to respond to short-term fluctuations in incentives or flows. Keeping the two concepts distinct avoids conflating temporary funding needs with permanent balance sheet losses.
The broader implication of this work is that Linea’s solvency is best preserved through explicit asset–liability management rather than fixed parameterization. Liquidity buffers, staking allocation, and redemption modalities are control variables that should move in response to observable signals, while reserves are held to absorb bounded, non-liquidity risks. Governance is therefore not an emergency backstop, but the control layer through which the bridge transitions between operating regimes.
In conclusion, Linea does not need to choose between yield and safety. By treating the bridge as a balance sheet, grounding decisions in historical stress behavior, and responding to clear market and network signals, native yield can be pursued without compromising solvency. Ultimately, this framework hopes to provide an understandable structure for managing liquidity and asset risk over time, with governance firmly responsible for how and when the system adapts.